Sunspots are patches on the sun’s surface which, at around 4,000°C, are considerably colder than their surroundings. They are formed by disturbances in the sun’s magnetic field.
The number, size and shape of the spots change constantly. While very few or even no spots are visible at the beginning of a cycle, their number and size increases until a maximum has been reached and the cycle starts from scratch again.
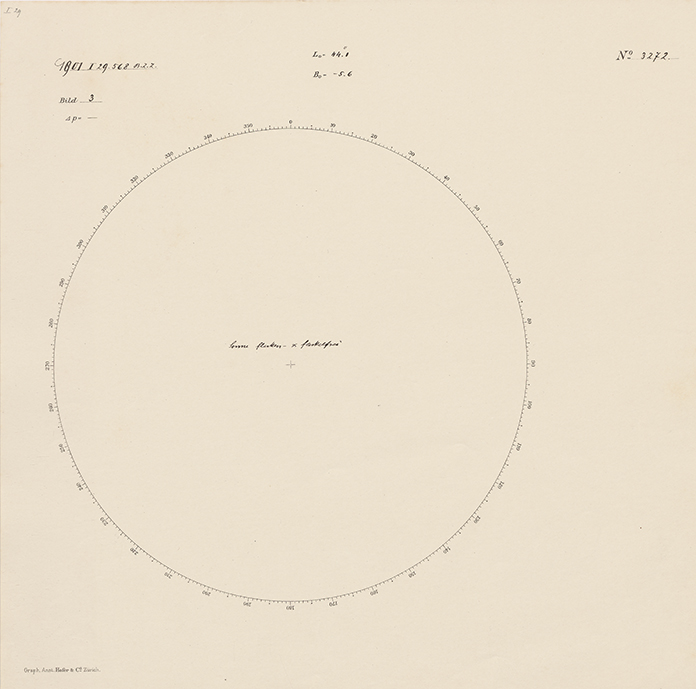
“The sun, spot and facula-free” (ETH Library, University Archives, Hs 1304:3272. Drawing of a sunspot from 29 January 1901).
The history of sunspot observations at ETH Zurich really began in Bern in 1847 with Rudolf Wolf’s appointment as head of the city’s observatory. By May of the following year, he already reported the observation of a large cluster of spots on the sun at a Nature Research Society meeting. By the time Wolf discovered a correlation between magnetic needle fluctuations and the emergence of sunspots in 1852, his interest in the subject had been aroused once and for all. In order to trace potential cycles in the formation of sunspots as swiftly as possible, Wolf began by looking into the past, collecting as many historical drawings of sunspot observations as possible in archives and libraries. He reconciled the heterogeneous descriptions by introducing the relative sunspot number and discovered that the various drawings dating back to the year 1610 indicated a cycle of around 11.1 years. Consequently, it is hardly surprising that Wolf immediately focused on solar research when he was appointed as a professor of astronomy at the Polytechnic School in Zurich (now ETH Zurich). As director of the Federal Observatory, he transformed Zurich into an international hub for solar research. He systematically continued the sunspot statistics he had compiled for the past for the present.
When Alfred Wolfer succeeded Wolf in 1894, he continued with the sunspot observations, introducing a new method for counting the spots. Parallel observations conducted using the old and new counting methods, and the use of the relative number guaranteed the continuity of the sunspot statistics. And Wolfer introduced another novelty: sunspot drawings. With the aid of a telescope, an image of the photosphere was projected onto a printed template, where the spots and faculae were drawn by hand. Counting sunspots has an inherent subjective component, which Wolf had endeavoured to negotiate with the relative number. Wolfer now added measurable factors, such as spot and facula size, and the determination of their order and coordinates on the photosphere. Wolfer had already started his projection image drawings as an assistant at the Federal Observatory in 1883.
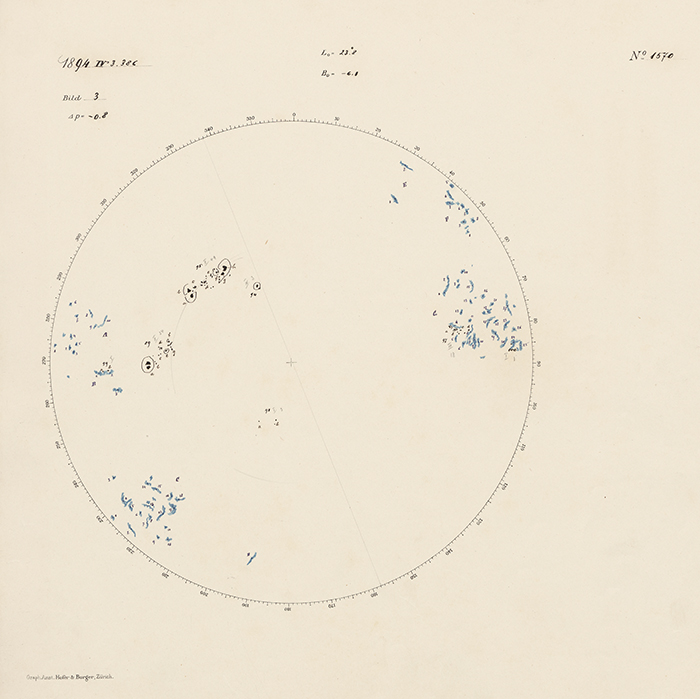
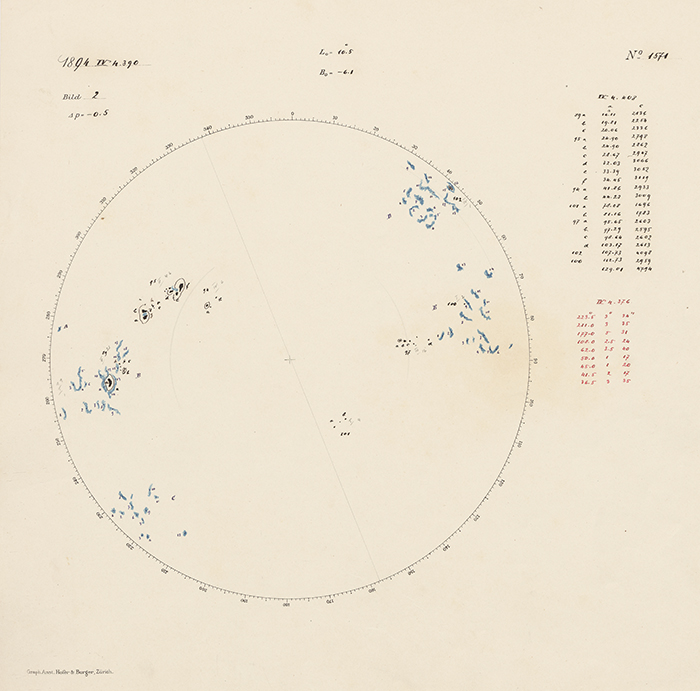
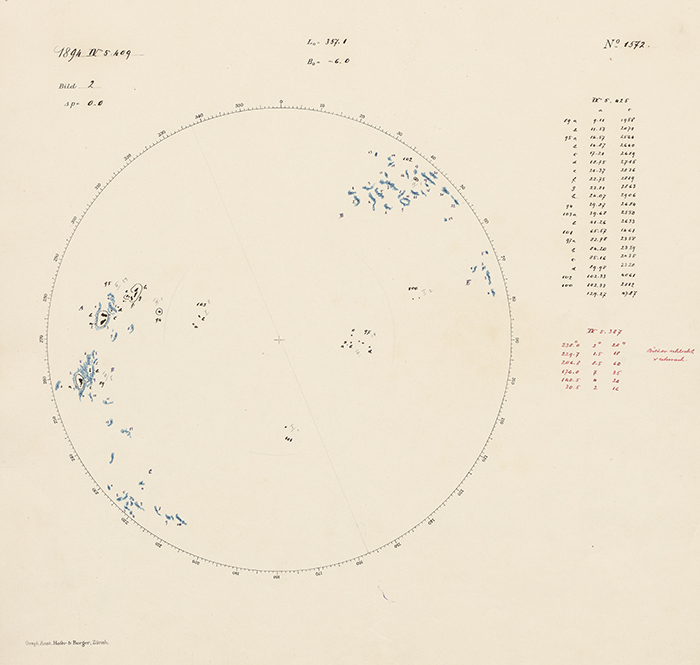
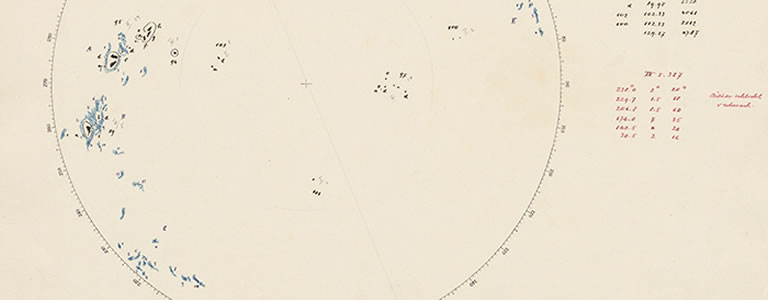
Drawings from a more active phase. It is nice to see how the spots wander on the revolving sun (ETH Library, University Archives, Hs 1304:1570-1572. Sunspot drawings from 3 – 5 April 1894).
Wolfer’s successors, William Brunner and Max Waldmeier, continued counting and drawing sunspots. In 1980, ETH Zurich decided to abandon systematic sunspot monitoring. Today, the roughly 28,000 drawings of the sun are curated by the ETH-Zurich University Archives.
Further reading:
H.U. Keller. Rudolf Wolf und die ehem. Eidgenössische Sternwarte in Zürich. In: Orion: Zeitschrift der Schweizerischen Astronomischen Gesellschaft, Jg. 51, No. 254, February 1993. pp. 4-11.
Abschied von der Eidgenössischen Sternwarte: Keine Weiterführung der Sonnenfleckenbeobachtungen. In: NZZ, 15.2.1980.